|
Doppler ultrasonography
The use of ultrasound with Doppler techniques in
medicine, particularly in the field of obstetrics and gynaecology has been around
for more than 3 decades. It had its success and failure in different areas,
with claims and counter claims. Doctors in all aspects of the speciality
claimed success, and beneficial use of the technique to improve results, with
contradictory reports soon to follow.
Using Doppler, in general, depends on the Doppler
shift principle, which measures the change in ultrasound frequency following
its scatter by a moving object, when received back by the transducer. The
moving object in this case is blood within blood vessels, plus the movement of
the vessel wall itself. A full account of all the physics involved is beyond
the remit of this book. Interested readers can find more related information in
specialised books. Furthermore, a lot about the clinical use of Doppler in gynaecology has already been given in different parts of this book including fertility scanning, ovarian cysts, and HyCoSy. Repetition will be avoided in this manuscript, by using the following links by interested readers, to study the corresponding information:
- Fertility Ultrasound [for natural and induced cycles monitoring, follicular neovascularisation, endometrial bed, and uterine artery blood flow, plus HyCoSy].
In this practical manuscript I will concentrate on
basic issues, which every gynaecologist should know, before attempting to use the
Doppler technique during ultrasound scanning. It will be a big mistake to build
a medical opinion on the results of a technique, which has not been well
executed. Chances of error in performing Doppler ultrasound are substantial,
without proper knowledge of the theory, and the method to obtain a good image. The
following 3 techniques will be described in bullet points, when possible, for
precision:
- Colour flow
imaging,
- Pulsed wave spectral Doppler imaging,
- Power Doppler.
Colour
Doppler
The primary purposes for using colour Doppler during
ultrasound imaging are: - It is used to document the presence and direction of blood flow within
the tissue, but does not show flow velocity
- Identifies the specific vessels of interest before being
examined,
- It is useful in differentiating between vascular and non-vascular structures,
- Identifies gross circulation anomalies in the examined
area,
- Helps in correcting the beam/vessel angle for velocity
measurement,
- Shows alterations of blood flow in certain organs, which
may indicate change in physiological function, or presence of disease.
However, many factors affect colour Doppler scanning, and these must be considered before using the technique for diagnostic purposes. The list includes: - The ultrasound power transmitted into the
tissue,
- The overall sensitivity is affected by the colour gain used,
- Sensitivity and resolution are related to probe frequency,
- Pulse repetition frequency (also called scale)
is important, as lower frequency is more effective to examine low velocities, and high
pulse repetition frequency reduces aliasing,
- Using colour Doppler to examine large areas
reduces the frame rate,
- Proper focusing of the ultrasound beam is
important, as colour flow image is optimized at the focal zone.
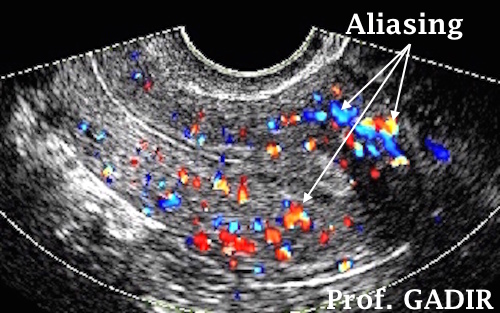
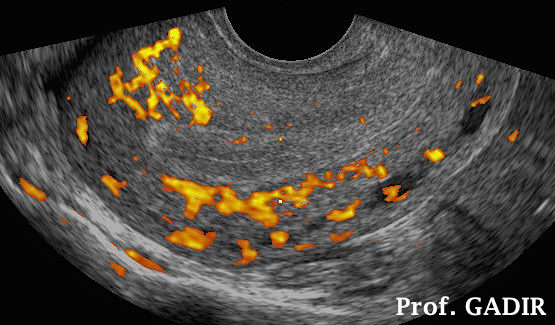
The direction of the blood
is depicted by colour on the monitor. Red colour depicts blood flow towards the
probe, while blue colour shows blood direction away from the probe. Lighter
hues of both colours may indicate aliasing, and the scale should be increased as first attempt to correct it. It can also be seen in turbulent flow, irrespective of machine adjustments. This may be seen in cases with
arteriovenous shunts.
The colour Doppler image above shows aliasing of myometrial blood vessels, with different hues of blue, red and yellow in the same area. Before switching the pulse wave, the colour scale should be increased to obtain uniform colours of red and blue. Other parameters to improve aliasing will be mentioned below
Pulsed
wave spectral Doppler mode During pulsed wave
Doppler, short bursts of ultrasound waves are generated and emitted into the
body at regular intervals, and received by the same piezoelectric crystal,
in an electronic probe. This allows measurement of the time taken by a specific
wave to reach the target and come back, and the change in pulse wave following
the scatter caused by the moving blood cells. Besides detecting these cells at
any specific depth, both quantitative and qualitative measurements can be done simultaneously.
In essences pulsed wave Doppler allows examination of
flow at specific sites, unlike the colour technique, which gives limited
information over a large region. Accordingly, using the two modes together
allows a specific vessel to be localised with the colour technique. This is
followed by analysis of the flow at that specific vessel, using the pulsed
Doppler technique.
Duplex and Triplex Doppler
techniques
It is not always necessary to use colour to
identify blood vessels, especially with large superficial ones, in non-obese
subjects. In this case, pulsed wave Doppler can be used directly, with real
time imaging over the well-visualised vessel. This technique is called Duplex
Doppler imaging. However, the Triplex technique
using the three modes of real time imaging, colour and pulsed wave Doppler
techniques, can be found in some new machines. Using all modes together increases the liability of aliasing, because of the reduced pulse repetition frequency. This
is also combined with reduction in the frame rate and colour flow box size; all
secondary to the fact that the same transducer element will be dealing with the
three modes at the same time.
With pulsed wave Doppler technique, both
qualitative and quantitative methods are used for flow assessment. The more
frequently used and easier to obtain, are the resistive index and pulsatility
index, which are qualitative indices. On the other hand, velocity, which is the
maximum shift over one cycle, and flow which is the average velocity times the
lumen area of the vessel are quantitative measurements. These last ones are
more reliant on proper setting of the machine, especially the angle of
insonation
All machines now give the
readings directly during Doppler examination, but it may be helpful to
understand how these measurements are obtained manually.
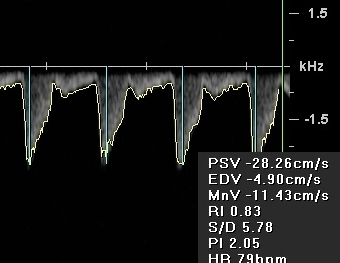
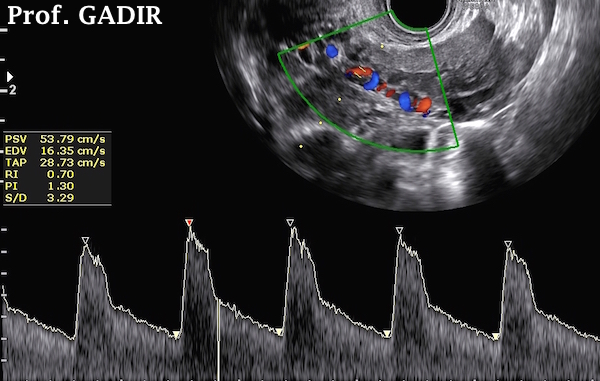
The pulse wave image above shows all the measurement
indices written electronically below the tracing. It shows peak systolic
velocity (PSV), end diastolic velocity (EDV), mean velocity (MnV), resistive
index (RI), systolic / diastolic ratio (S/D), pulsatility index (PI), heart
rate (HR) Measurement indices
- Pulsatility index is the term used to represent the
ratio of peak systolic velocity end diastolic velocity divided by time averaged
velocity [(PSV+EDV) / 2].
- Resistive index is
the term used to represent the ratio of peak systolic velocity - end diastolic
velocity divided by peak systolic velocity. Accordingly, the maximum reading should be one.
- Velocity is the
maximum shift over one cycle.
- Flow is the average
velocity times the lumen area of the vessel.
Power Doppler
Power
Doppler is a technique where the colour flow output magnitude is displayed,
rather than Doppler frequency signals. It does not show the direction of flow
or blood velocity. It is more sensitive in detecting low flow velocities,
especially when used in combination with frame averaging. Few of the newer
machines are now providing power Doppler with direction of flow, as well as
modes combining power and velocity data, to improve sensitivity.
Anatomy of uterine and ovarian vessels The
uterine arteries
Normally the uterine artery joins the uterus
at the level of the endocervix. The curved up vessels can be detected with
colour mapping. It is important to know if one is examining the major trunk, or
one of its ascending branches. It is usually easy to get a good image, except when large
uterine fibroids or ovarian cysts are occupying the area, and denying access to the blood vessel. Generally the uterine arteries have high resistance and systolic flow, with a diastolic notch during the follicular phase. There is further increase in velocity during the luteal phase, together with increased diastolic flow.
Ovarian
arteries:
The ovarian vessels enter the ovaries at the upper outer corner, and are usually difficult to sample, due to the suboptimal angle of
insonation. - During the follicular phase, ovarian arteries have low velocity with low diastolic flow. Resistance to flow is 40% lower in vessels inside the ovary, compared to the main
artery itself.
- During the luteal phase there is increased blood velocity and reduced resistance, in the ovarian vessels. Furthermore, the pulsatility index is lower in the artery on the same side as the
dominant follicle and corpus luteum, than in the contralateral vessel.
- Progressive neovascularisation and increased vascularity of the dominant follicle occurs by the time of LH surge, up to follicular rupture, and formation of the corpus luteum.
- There is no more neovascularisation of the corpus luteum after ovulation, when the blood vessels are usually dilated to their maximum, and blood flow does not increase even after exogenous oestrogen medication.
Practical reproductive implications Without going into great details, the following points are important to remember during utilisation of Doppler studies in the fertility clinic:
- Ovarian and uterine artery pulsatility index decline after ovulation,
- There is a negative correlation between PI on one hand, and the number of follicles and aspirated oocytes during IVF cycles,
- PI is lower in women with better endocrine response than poor response,
- The number and size of stromal blood vessels increase with follicular development,
- Better radial and spiral arteries perfusion is seen in natural compared to stimulated cycles,
- Absent uterine artery end diastolic flow was reported more in infertile women,
- Studies were disagreeable regarding PI and RI importance in predicting IVF cycles outcome,
- Increased endometrial blood flow is expected with pregnancy and neoplasia, but not in a pseudosac associated with ectopic pregnancy,
- Endometrial vasculature, uterine arteries PI, and the presence or absence of a diastolic notch in uterine arteries pulse waves are few criteria used to monitor early pregnancy,
- Umbilical and mid cerebral artery blood flow waveform studies are used to monitor fetal well being during antenatal care,
- In men, use of Doppler scanning was mainly concentrated in studying penile blood flow, in patient with erectile dysfunction, probably related to diabetes, or other vascular issues.
- The top left colour Doppler image shows some neovasucalisation of a mature follicle.
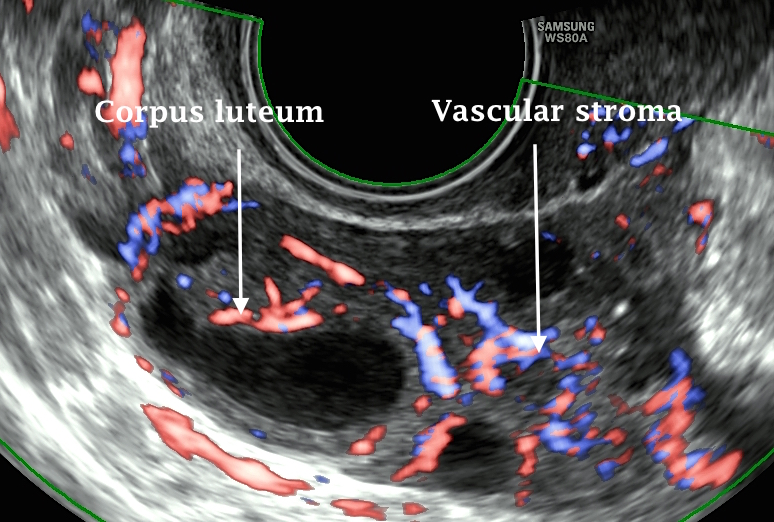
- The second top image shows a very vascular corpus luteum, generated by the same follicle. Note the good stromal vascularisation, as well.
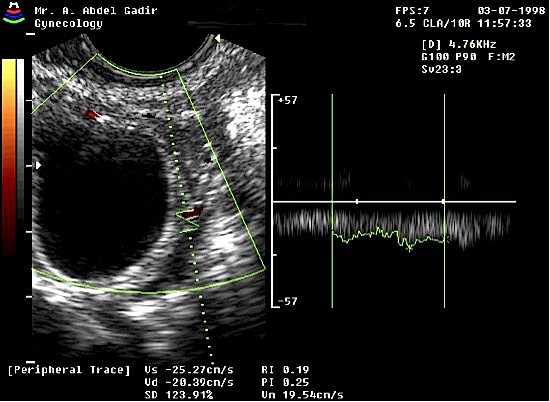
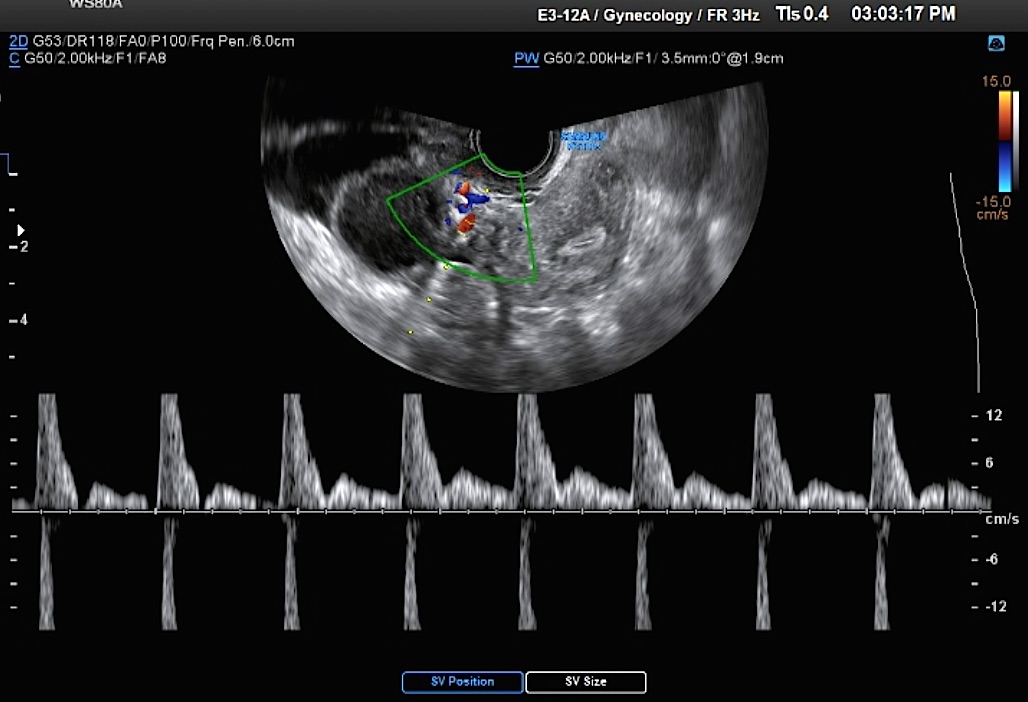
- The first colour Doppler image in the second row shows almost continuous pulse wave flow from a blood vessel within the thick wall of a corpus luteum. This possibly represents the maximum vessels dilatation, and blood flow once a corpus luteum is formed. This is represented by the very low values of the measurement indices [RI 0.19, and PI 0.25].
- The second image in the second row above shows a power Doppler sagittal view of a uterus, at the periovulatory stage, with a rich endometrial and subendometrial blood plexus. These are considered to be signs of good endometrial receptivity.
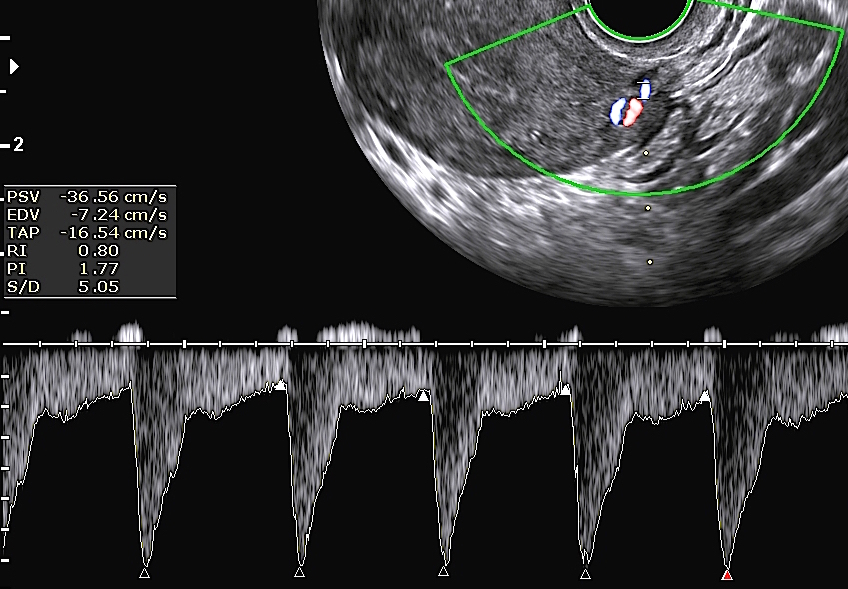 |  |
- The first Doppler pulsed waveform image above shows good uterine artery blood flow, during both systole and diastole. The PI was 1.77 and RI 0.8. This pattern usually represents good ovulation, and better chances of pregnancy.
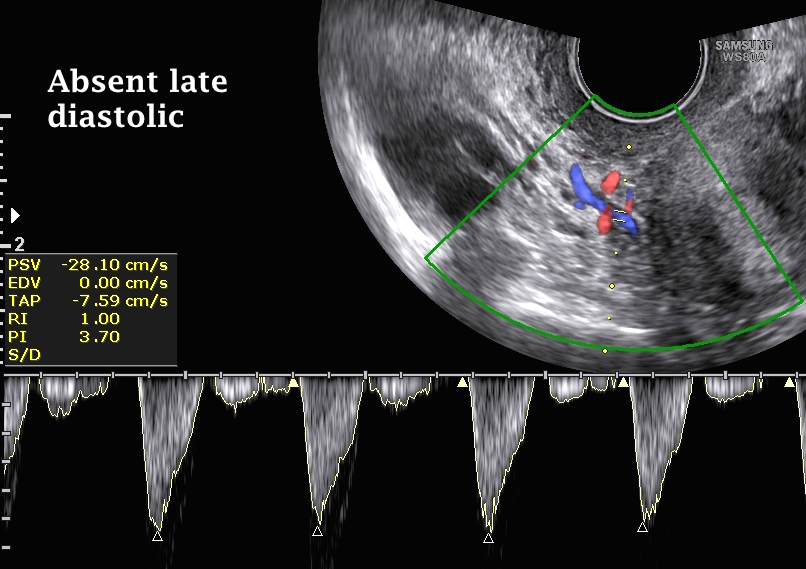
- The second image above shows a similar Doppler image, but with absent uterine artery late diastolic flow. This pattern has been reported to be associated with infertility. Furthermore, the PI and RI were 3.7 and 1.0 respectively, indicating less adequate ovulation.
Tubal testing
In recent years, colour Doppler imaging used with hysterocontrastsalpingography (HyCoSy), almost replaced hysterosalpingography, as the standard method for testing the fallopian tubes. This is especially true in many centres, with advanced ultrasound services (including our own). It is a very quick procedure, which does not involve any radiation. The technique is especially useful in women with distended bowel loops, being obese or not, as bowel shadows interfere with the sensitivity of the procedure. Using colour Doppler saves time, and confirms the diagnosis in difficult cases . It is also useful in cases with fibroids, as the colour can be traced around the mass. Thorough information about the subject has already been given in the HyCoSy section.
Practical pathological implications - Can differentiate between fibroids, with their peripheral vasculature, and the vascular pass-through pattern seen in adenomyosis. This has been shown before in the Gynaecology and Fibroids sections.
- Increased endometrial blood flow is seen with pregnancy and neoplasia, but not with a pseudosac.
- Ovarian and cervical cancer can show bizarre vasculature, as they lead to growth of the existing vessels, plus neovascularisation as well. The reduced resistance seen in these cases is related to the attenuation of the tunica media portion of the blood vessels, induced by the malignant cells. This may lead to arteriovenous shunting.
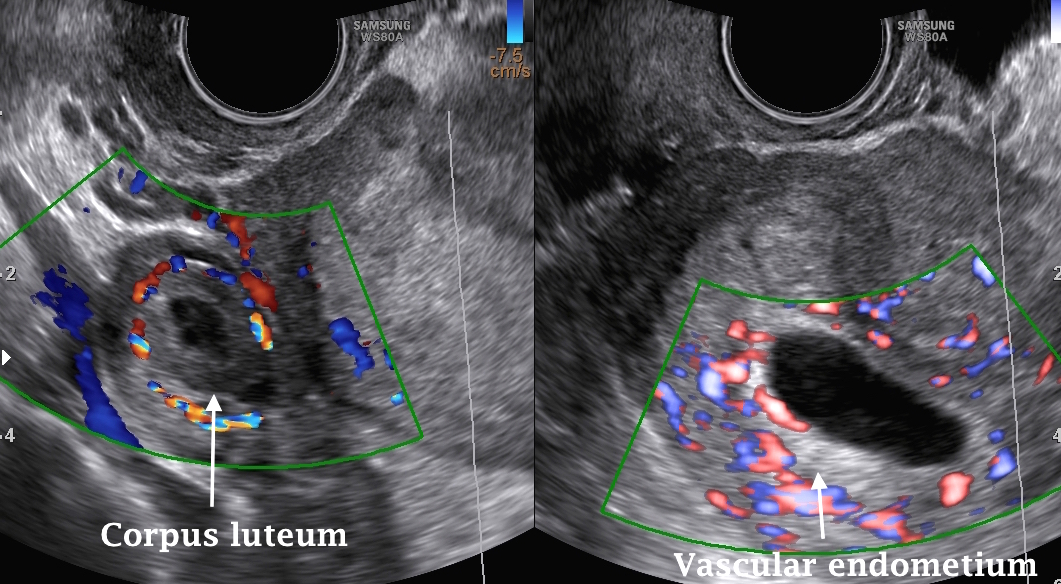 |
The two colour Doppler images shown above depict a vascular ring structure in the right adnexa, and a vascular empty uterine cavity. The patient had a positive pregnancy test, and was referred to our centre, with a suspected ectopic pregnancy. The vascular ring proved to be a corpus luteum in the right ovary. Having such vascular endometrium almost excluded the suspected diagnosis. A pseudosac is never vascular.
The Doppler image above shows uterine artery pulsed spectral waves from a uterus with multiple fibroids. Note the high systolic and diastolic flow, indicating increased vascularity of the uterus, which is common with fibroids.
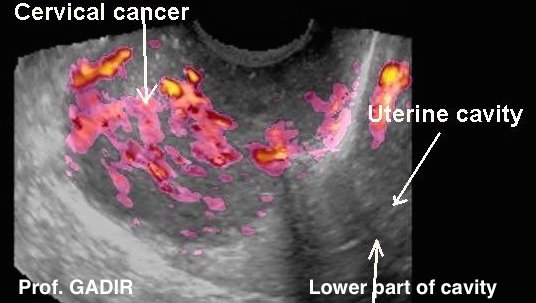
Role of Doppler ultrasound in cervical cancer As mentioned in the Basic Gynaecology Section, transvaginal ultrasound examination is not a recognised method for cervical cancer screening. However, the presence of a cervical mass, with bizarre colour Doppler mapping, should raise this suspicion. The other possibility is cervical ectopic pregnancy.
- The first ultrasound image above shows a sagittal view of a cervix, with a large necrotic mass occupying most of the cervix. A narrow stripe of intact tissue can be seen posteriorly. The lower part of the uterus is also visible, with a clear thin endometrial echo. The cervical canal is no longer identifiable, which is a characteristic ultrasound finding in most cases with advanced cervical carcinomas.
- The second power Doppler image shows increased cervical vascular markings, as depicted by power Doppler mapping. This area proved to be squamous cell carcinoma.
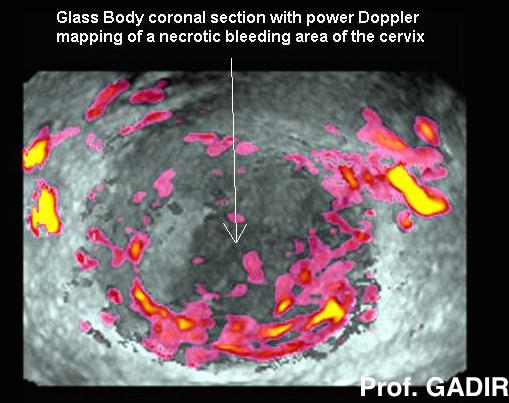
- The third image shows a glass body power Doppler coronal section of the cervix, with bizzare intense peripheral vascularity, fading inwards, towards the central necrotic area.
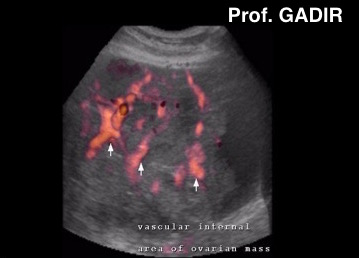
Role of Doppler ultrasound in ovarian cancer Doppler studies did not fulfil the great expectations raised initially in helping with the diagnosis of ovarian malignancy. The initial plethora of articles documenting particular cut off figures of PI and RI have been replaced by non-numerical criteria, for that purpose. With ovarian masses, penetrating vessels with bizzare arrangements into the mass, along the septae, or into papillary excrescences are more suggestive of malignancy. This is contrary to the peripheral arrangement of blood vessels seen around benign tumours. The 3D power Doppler image below demonstrates a bizarre penetrating vascular pattern in an ovarian mass, which proved to be malignant.
Doppler ultrasound technique To have successful Doppler examination, the operator should have good knowledge of the following points about the examined vessel, which are collectively known as the vessel Doppler signature: - The location of the blood vessel to be examined,
- The pulse sound wave characteristic,
- The pulse wave appearance.
Before switching the Doppler on, a real time image of the identified artery must be obtained, and verified with colour flow imaging. Always attempt to orient the beam parrell to the flow, to have the best quantitative estimates of flow. Place the gate to cover the entire cross sectional area of the vessel. Switch pulsed Doppler on, to get good flow waveforms, based on sound and visual recognition of the right signal. Freeze the machine, and take note of the measurement indices. Take a record of the result. Repeat the examination if ever in doubt, or for confirmation. The most common artefact in colour and pulsed waveform Doppler imaging is aliasing. It occurs when the upper limit of the displayable Doppler shift is exceeded. This is known as Nyquist limit. It is calculated as the pulse repetition frequency / 2. In other words, aliasing takes place when the high velocity blood flow generates Doppler shift exceeding half the pulse repetition frequency. To correct this artefact, the following adjustments need to be done: - Use a shallow depth of imaging to increase the pulse repetition frequency, which is reciprocally related to the pulse repetition period. Shallow imaging decreases the last parameter, hence increases the PRF, and reduces the Nyquist limit,
- It is important to adjust the colour gain properly to avoid causing aliasing,
- Increase the pulse repetition frequency (the scale),
- Change the angle of insonation,
- Use a high frequency probe,
- Adjust the baseline up or down, according to the direction of the tracing. This does not really correct the aliasing, but may affect the way it is displayed.
The Doppler image above shows multiple waves with peaks falling below the baseline. This artefact is known as aliasing. In newer machines, using automatic or quick function facility during pulsed wave spectral Doppler examination, can adjust the scale and baseline automatically, to correct aliasing.
Prevention of aliasing during colour Doppler mapping, to have pure red and blue hues can done by increasing the pulse repetition frequency / the scale. However, over correction of the scale may lead to loss of colour especially, in vessels with slow flow like the corpus luteum.
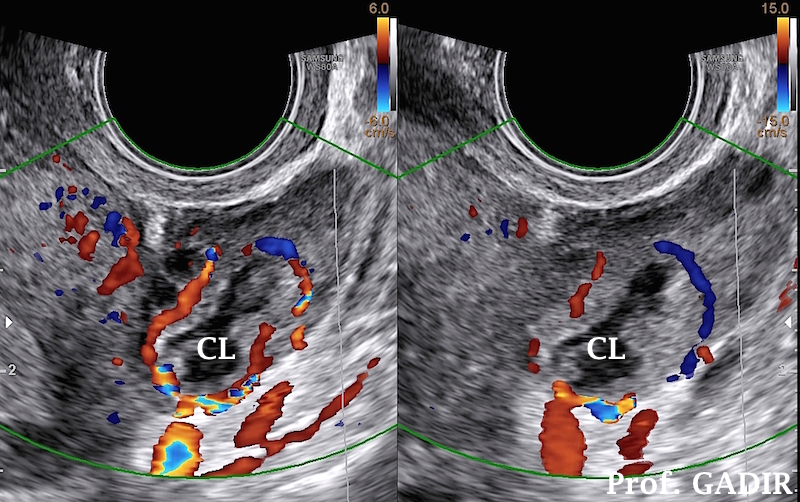
- The first double colour image above shows a corpus luteum with a vascular peripheral ring. The left part of the image shows colour aliasing, with different hues of colour. This was almost lost in the second half of the image. Note the colour scale on the left side is + or - 6, where as it is increased to + or - 15 in the neighbouring image..
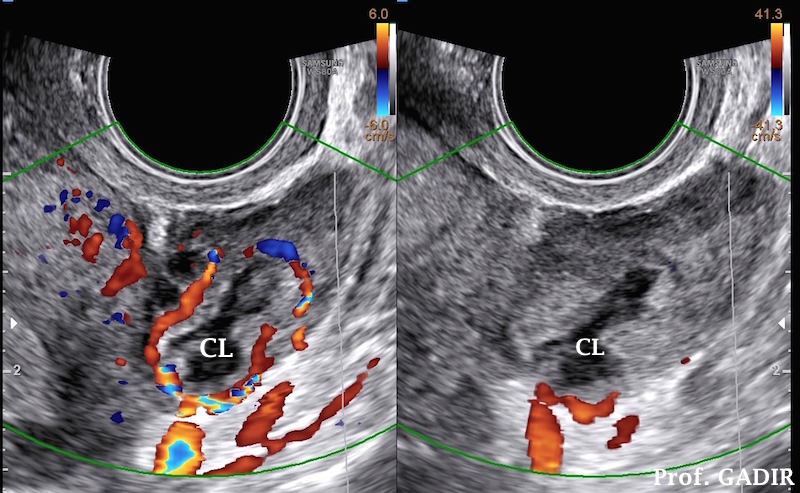
- The second double colour image shows the same corpus luteum with colour aliasing in the left image. Over correction of the colour scale in this case to + or 41, lead to almost complete loss of the colour ring around the corpus luteum. This should be avoided during scanning of vessels with slow blood flow, otherwise wrong diagnosis of absent blood flow will be made.
Final Note
Doppler imaging is a very useful tool, when used properly, and for the right purpose. It is a technique which needs prior dexterity with the ultrasound machine itself, and excellent acquisition and optimisation of the real time image. This brings us back to the topic of Knobology, which I still think is the most important technique to learn first. I have only touched on the practical, and basic aspects of Doppler imaging in this book, as the subject is very wide, and deserves to have a book by itself.
|